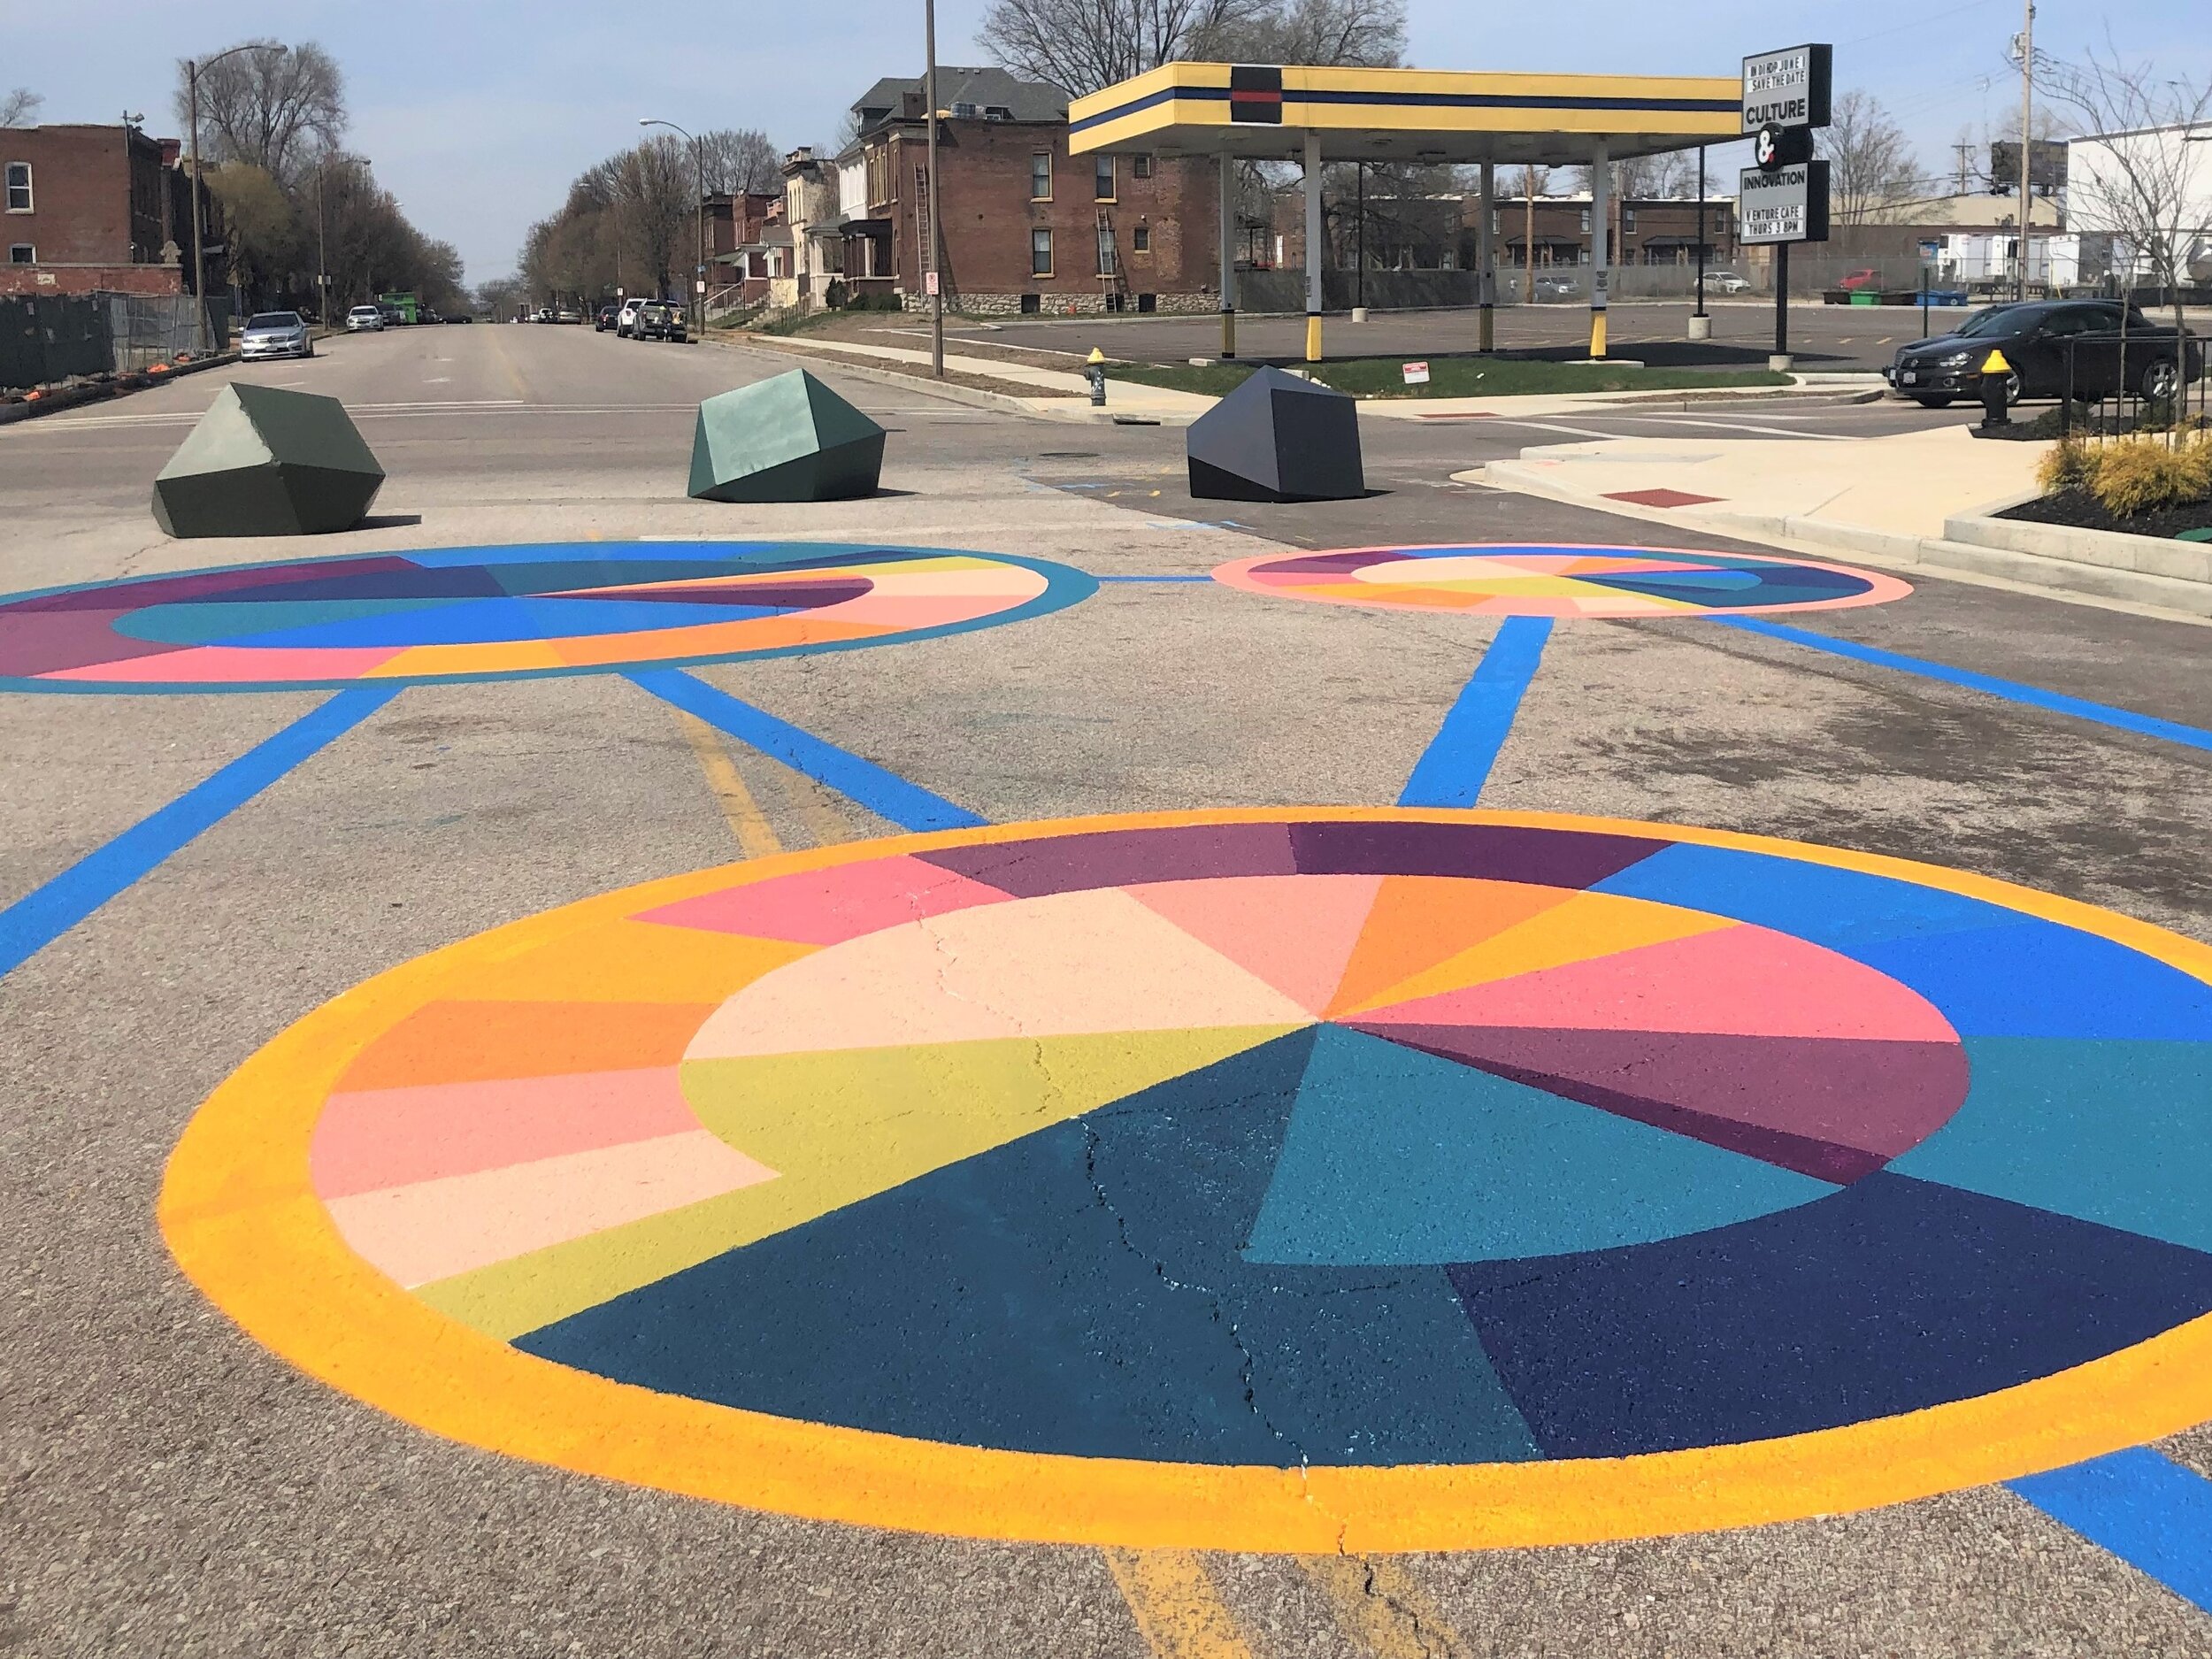
River Cities Population Map.
Installed 2019, “River Cities Population Map” is a large-scale data visualization by Ellie Balk on the ground plane at Chroma Plaza in The Grove. The mural graphs the population of St. Louis and 11 river cities, chosen by recent boom in tech culture, through time from 1900-2017. Circle graphs are sized based on current population and placed geographically in the space. Lines connect the circles, showing the distance between cities and creating shapes that play off of the geometric facets of the bollards.
The design sparks fun and engagement through its interplay within the physical space and with the data itself. For example, you might notice that years seeing a decline in population are not shown in the middle circle, where you see which years the city had its largest increase in population. The largest population and growth for St. Louis will show in earlier, not recent years, as more recent years have seen a decline. While the data adds an extra layer of dimension and interaction, the colors and shapes can be viewed on the surface level as a playful, geometric design.

Featured…
Read more about the mural in Alive Magazine and the St. Louis Jewish Light or on Ellie Balk’s website.
“Concept in Color: New Public Art Captures the History and High Energy of The Grove”
“Mural artists’ big pictures are all about the tiny details”
VISIT THE MURAL